Power BI · Data cleaning
Event Visitor Registration Dashboard
An event organizer sent visitor registrations as 3 messy files. We merged and cleaned them, then built one dashboard to track registrations, attendance and channels.
- 1Combine3 files, 6,060 rows
- 2Cleanduplicates, phones, emails, names
- 3MeasureDAX for the 3 KPIs
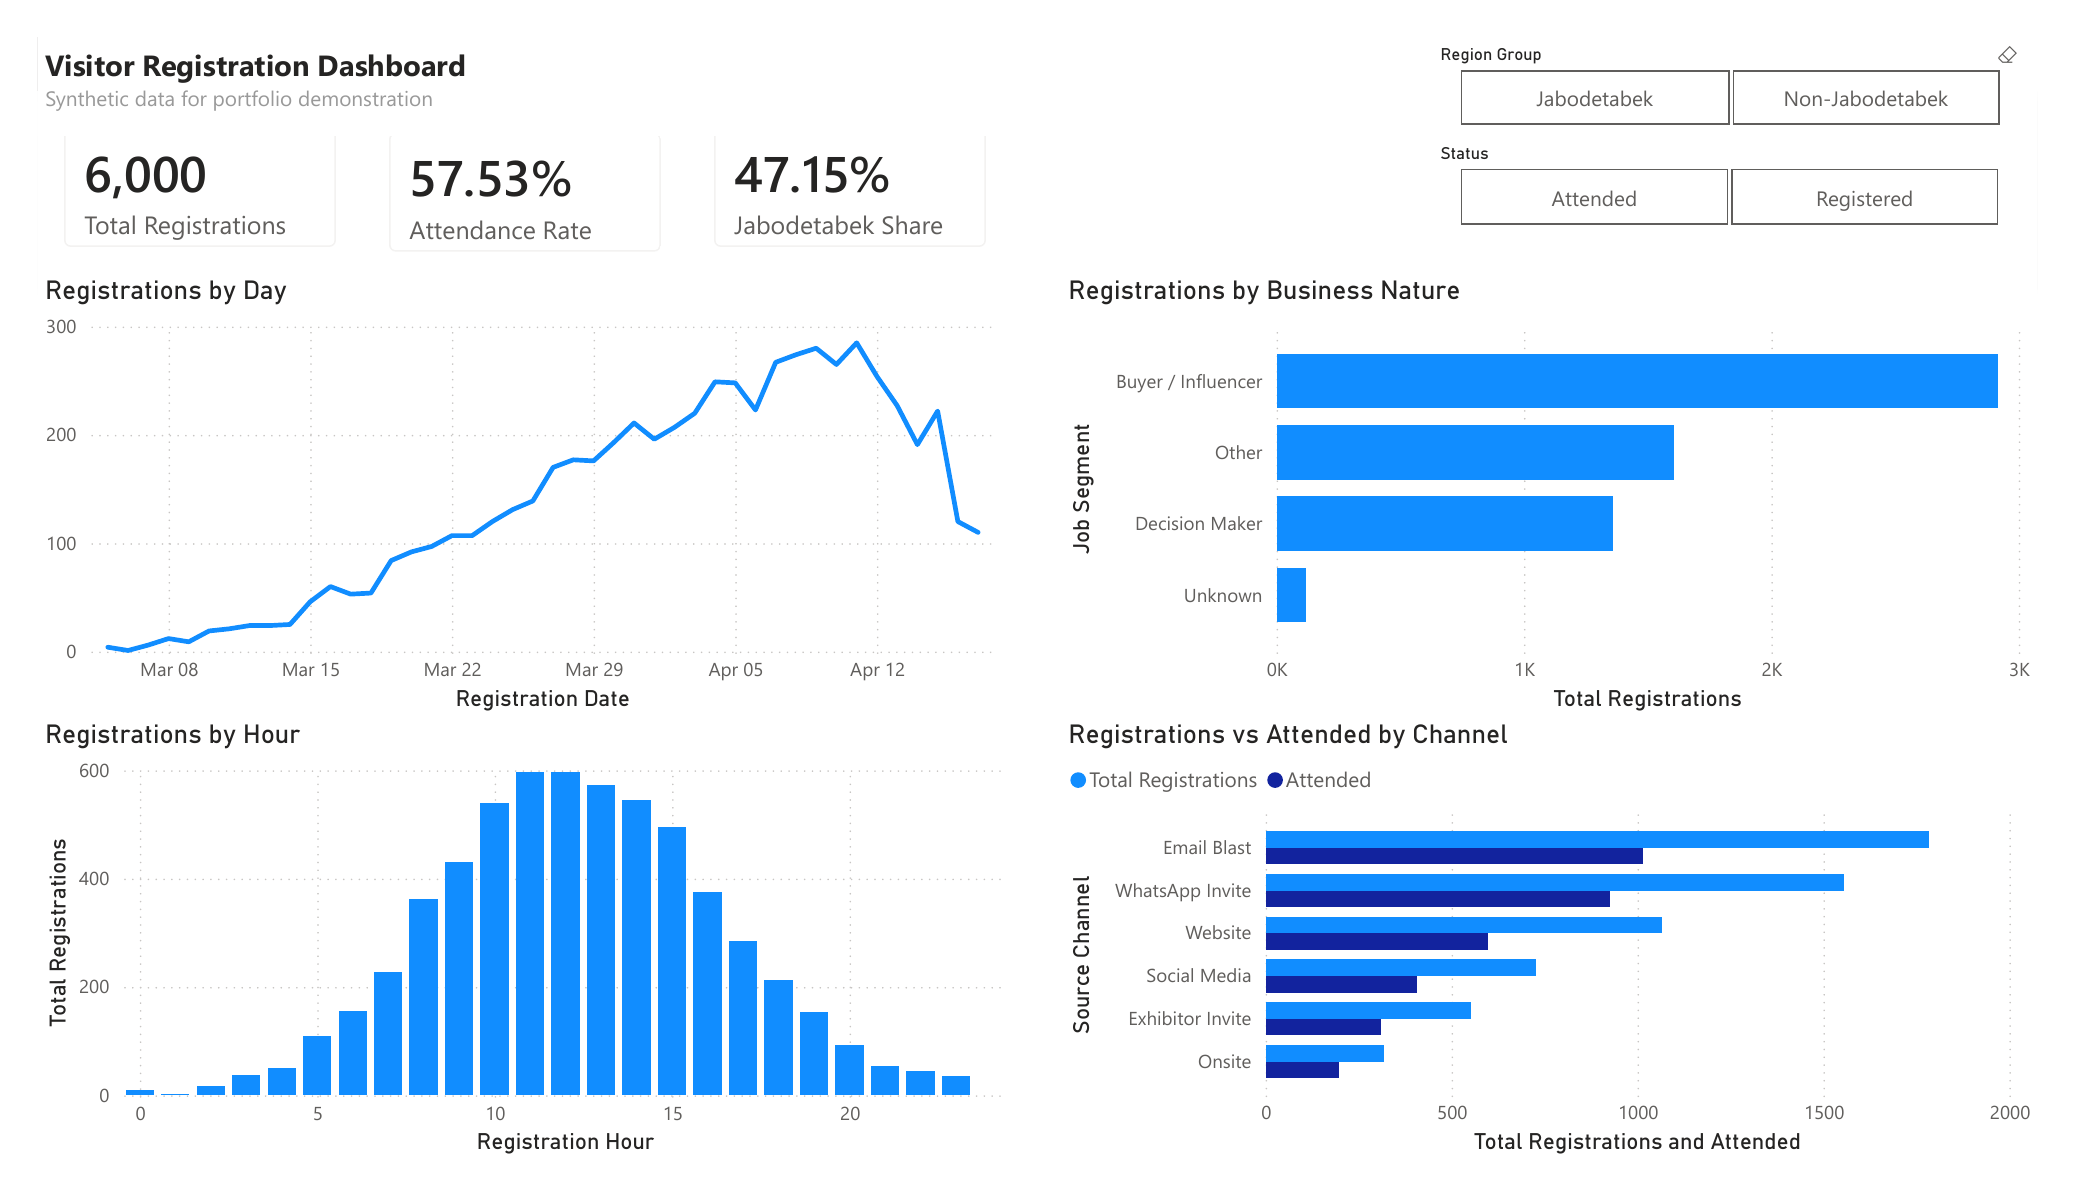
- 4Dashboard6,000 clean rows, 3 views →
6,000registrations
57.53%attendance
47.15%Jabodetabek
What we did
What we did
- Combined 3 source tables in Power Query and removed duplicate ticket codes.
- Standardized names, cities, emails and phone numbers (all to the 62… format).
- Filled 120 blank job titles as "Unknown" so no visitor drops out of reports.
- Added calculated columns: Region Group, Job Segment, Registration Date and Hour.
- Wrote DAX measures for registrations, attendance and regional share.
What the dashboard answers
- When people register: by day and by hour.
- Who registers: business nature and job segment.
- Which channels bring people who actually show up.
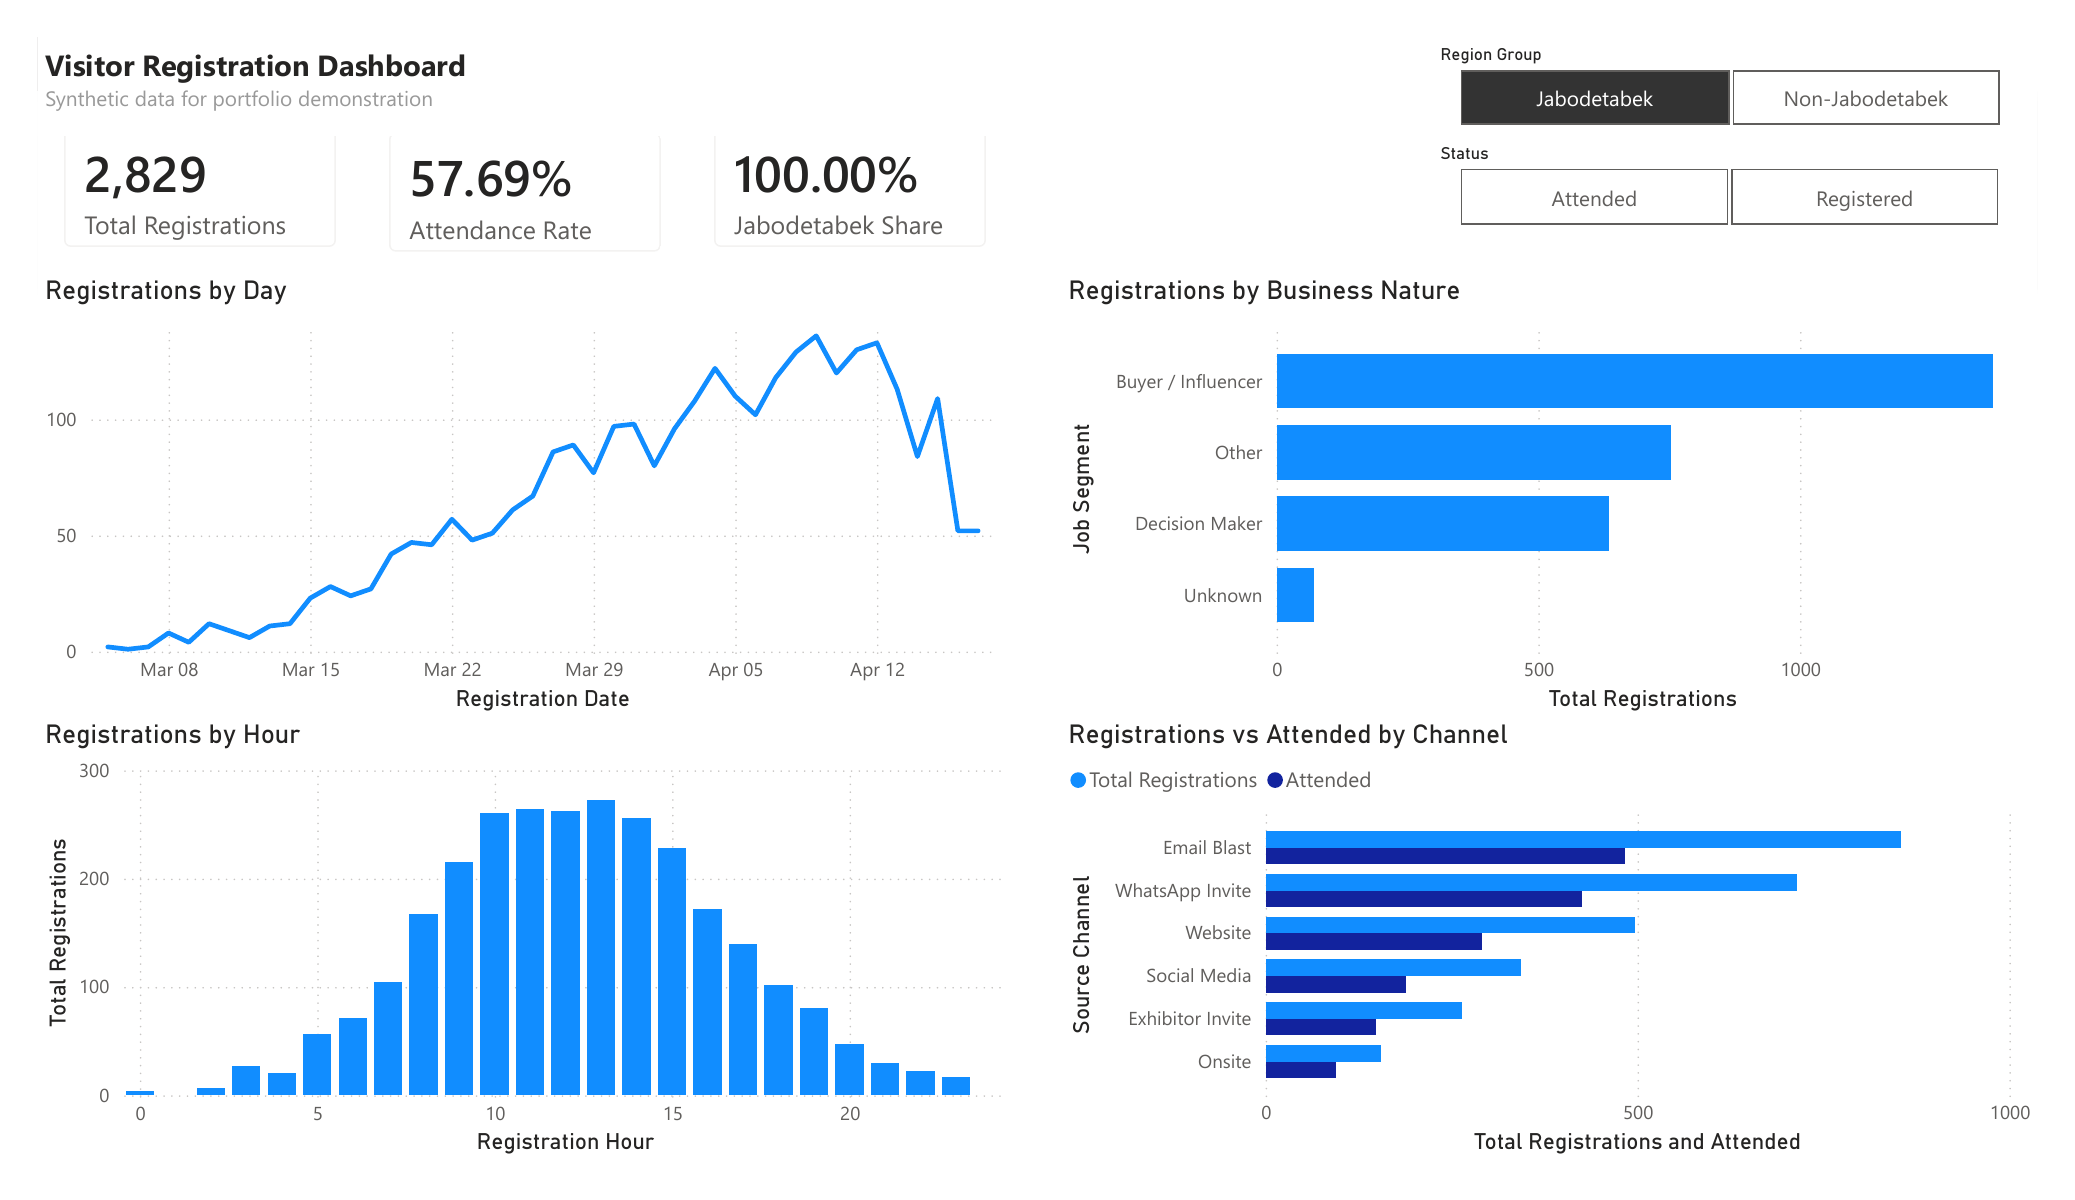
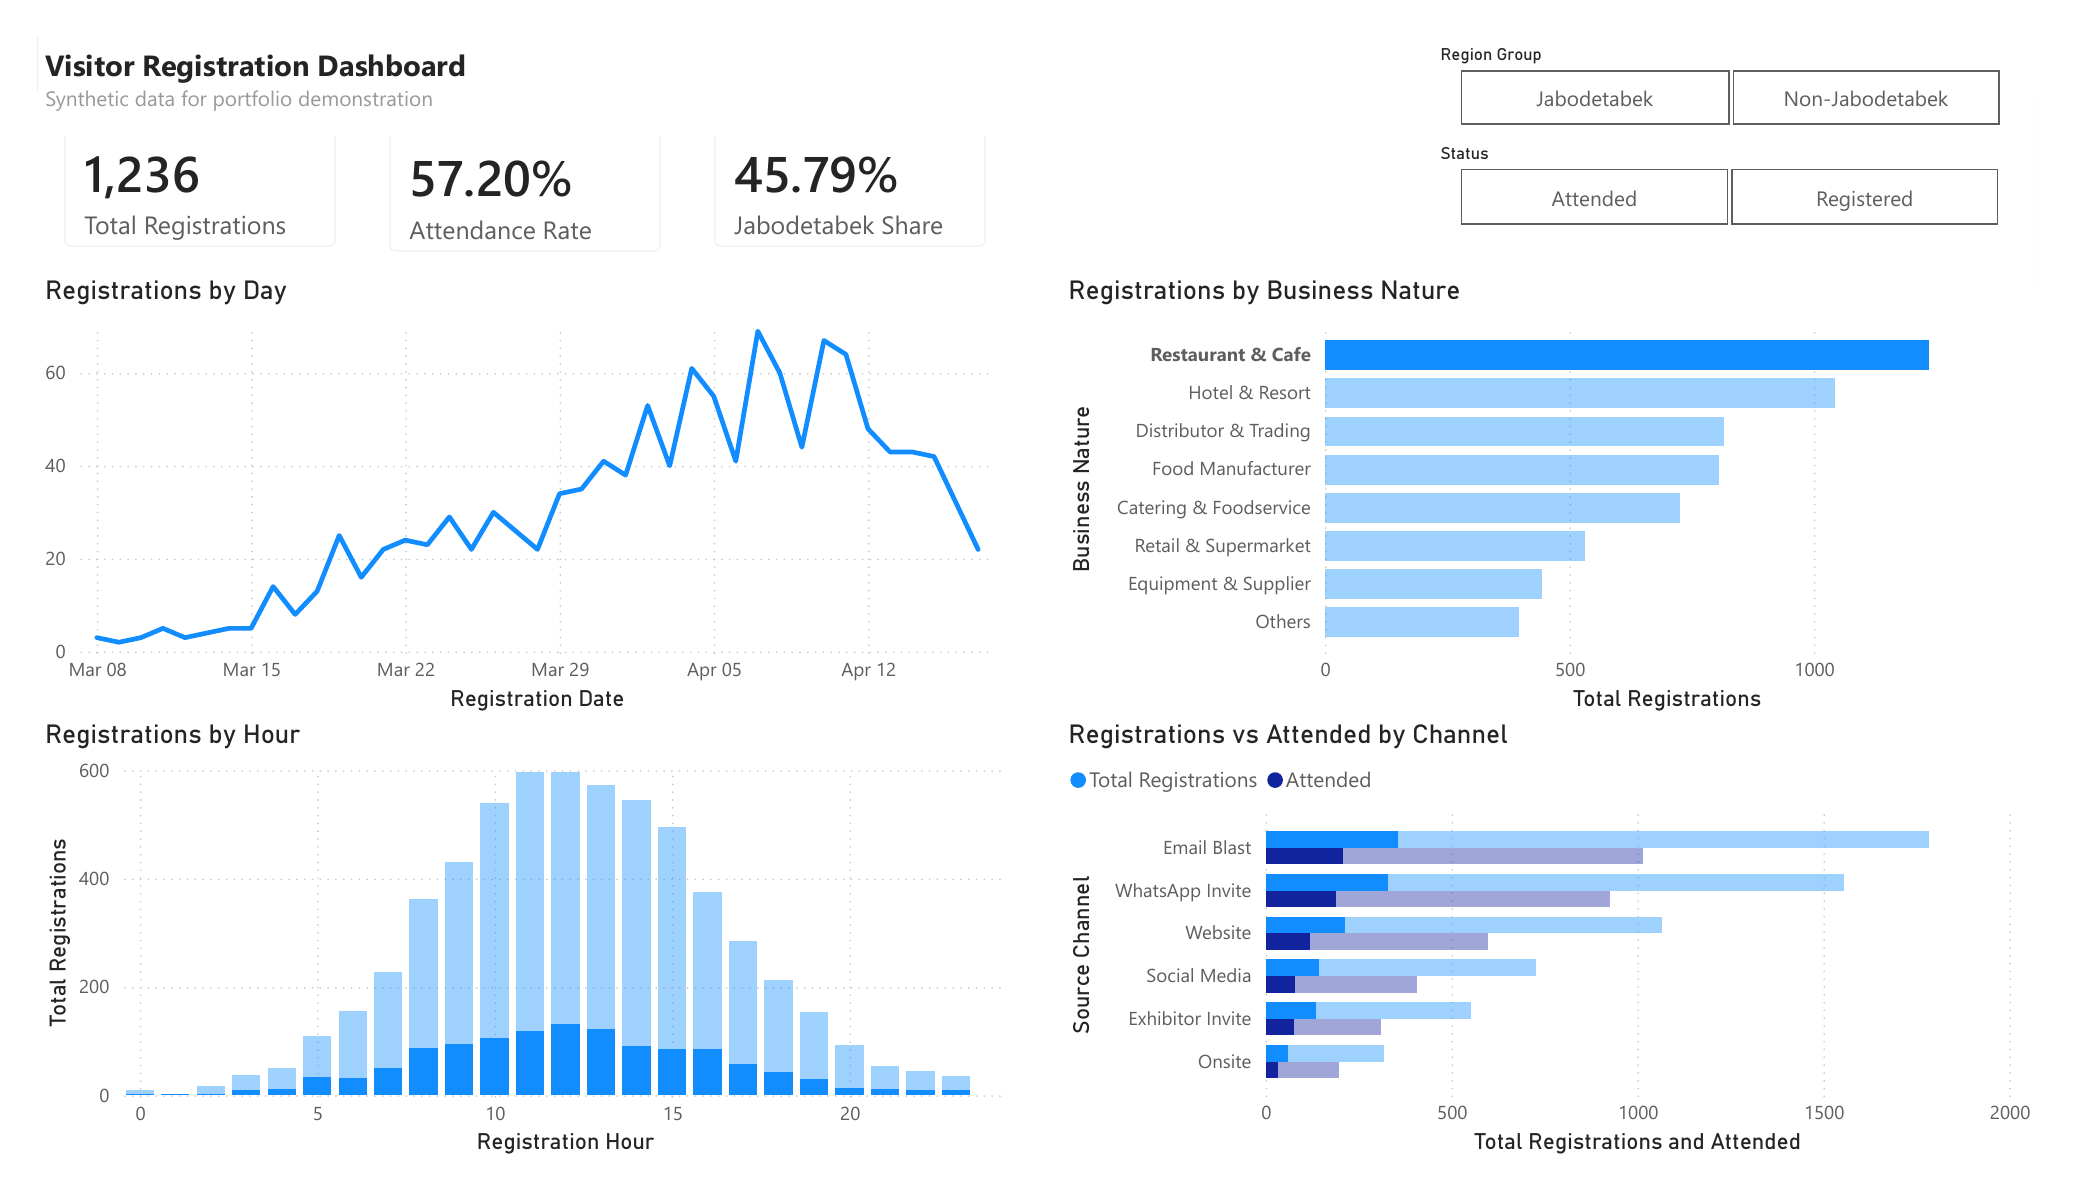
- Filters for attendance status and region.
Step 2 · Before and after cleaning
Real rows from the source files and how they look after the Power Query steps.
| Field | Before | After |
|---|---|---|
| Full name | KIKI HIDAYAT | Kiki Hidayat |
| Full name | citra permata | Citra Permata |
| City | BANDUNG | Bandung |
| Phone | 0803-2848-4330 | 6280328484330 |
| Phone | +62 880 1551 127 | 628801551127 |
| Phone | 08260440952 | 628260440952 |
| eka.halim63@gmial.com | eka.halim63@gmail.com | |
| gita.nugroho22@example.co,id | gita.nugroho22@example.co.id | |
| Job title | (blank) | Unknown |
Synthetic data for portfolio demonstration. Duplicates were removed by Ticket Code, keeping the first record found.
Step 3 · Selected DAX
The measures behind the three headline cards.
Total Registrations = COUNTROWS ( Registrations )

Attended =
CALCULATE ( [Total Registrations], Registrations[Status] = "Attended" )

Attendance Rate = DIVIDE ( [Attended], [Total Registrations] )

Jabodetabek Share =
DIVIDE (
    CALCULATE ( [Total Registrations], Registrations[Region Group] = "Jabodetabek" ),
    [Total Registrations]
)
Need a dashboard or cleaner data?
Send us a sample of your data and what you want to track. We will tell you what we can build and how long it takes.
Chat me on WhatsAppEmail usUpwork profileGitHubLinkedIn